Content
Portable devices used to record visitor movement patterns, routes, speed, and stay times, providing spatially explicit data to better understand visitor flows and site use.
Classification
Key characteristics
Tool description
Constraints
- Participation is voluntary, which may result in limited or biased samples.
- Data quality depends on satellite reception (reduced accuracy in dense forests, narrow valleys, caves, or urban canyons).
- Devices require battery management and data retrieval.
- Visitors may alter their behavior when carrying a tracking device.
- Data protection and privacy regulations must be strictly followed.
- GPS tracks do not explain motivation or perception without complementary survey data.
Requirements
- Clear informed consent procedures and privacy compliance
- Sufficient number of charged and configured GPS loggers
- Defined recording intervals and standardized deployment protocols
- System for data download, storage, and secure processing
- Staff for visitor briefing, device distribution, and collection
- Complementary data (e.g. visitor surveys) for behavioral interpretation is recommended
- GIS system and competencies in geographical data analysis and interpretation or collaboration with institution that can offer this service
Tool Impact
Best Practices
-
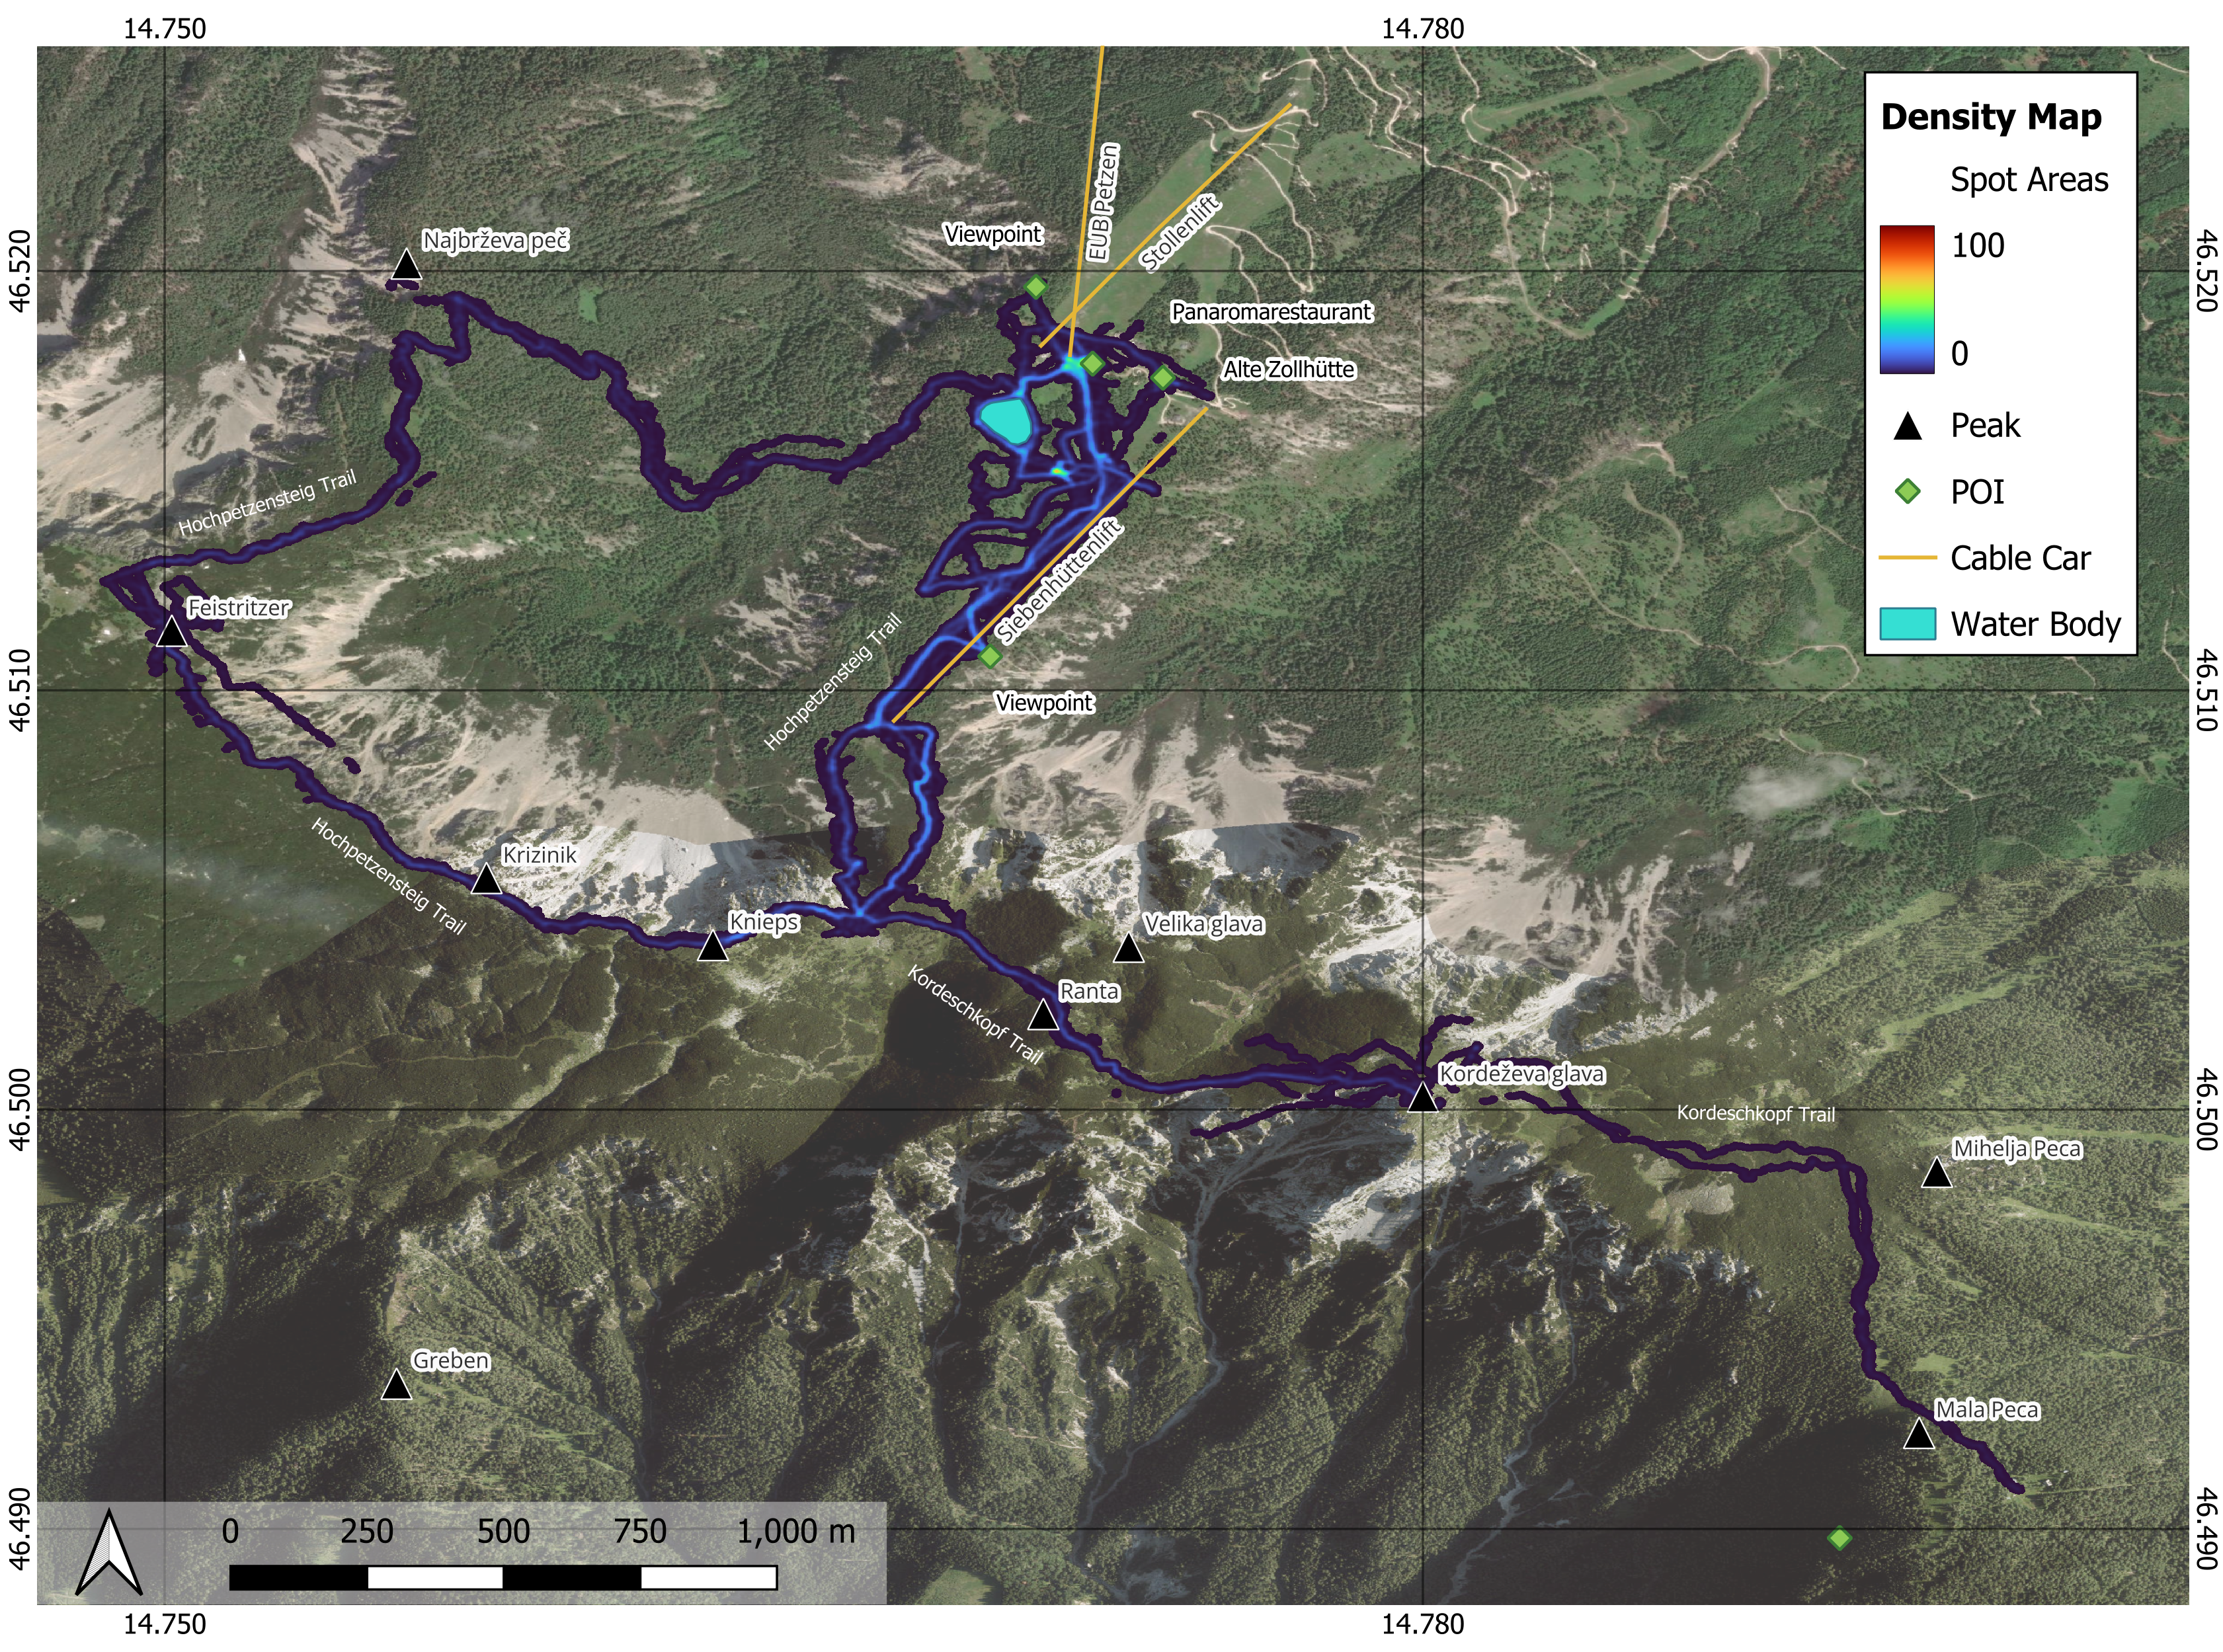
Within the Interreg CE project HUMANITA, 69 GPS loggers were deployed in the Karawanken–Karavanke UNESCO Global Geopark to analyze visitor movement patterns. After systematic data cleaning (removal of incomplete tracks, GPS errors, and outliers), the dataset was used to produce standardized visitor density and intensity maps.
- The Density Map (heatmap of visitor counts) visualizes how frequently specific areas were used. The standardized scale from 0 (low use) to 100 (high use) allows clear identification of:
- Main visitor routes and frequently used trails
- Spatial concentration of visitor flows
- Hotspots with particularly high traffic pressure
- Low-use or undisturbed areas
- Potential conflict zones between tourism and sensitive habitats
- This map primarily answers the question: Where do visitors go?
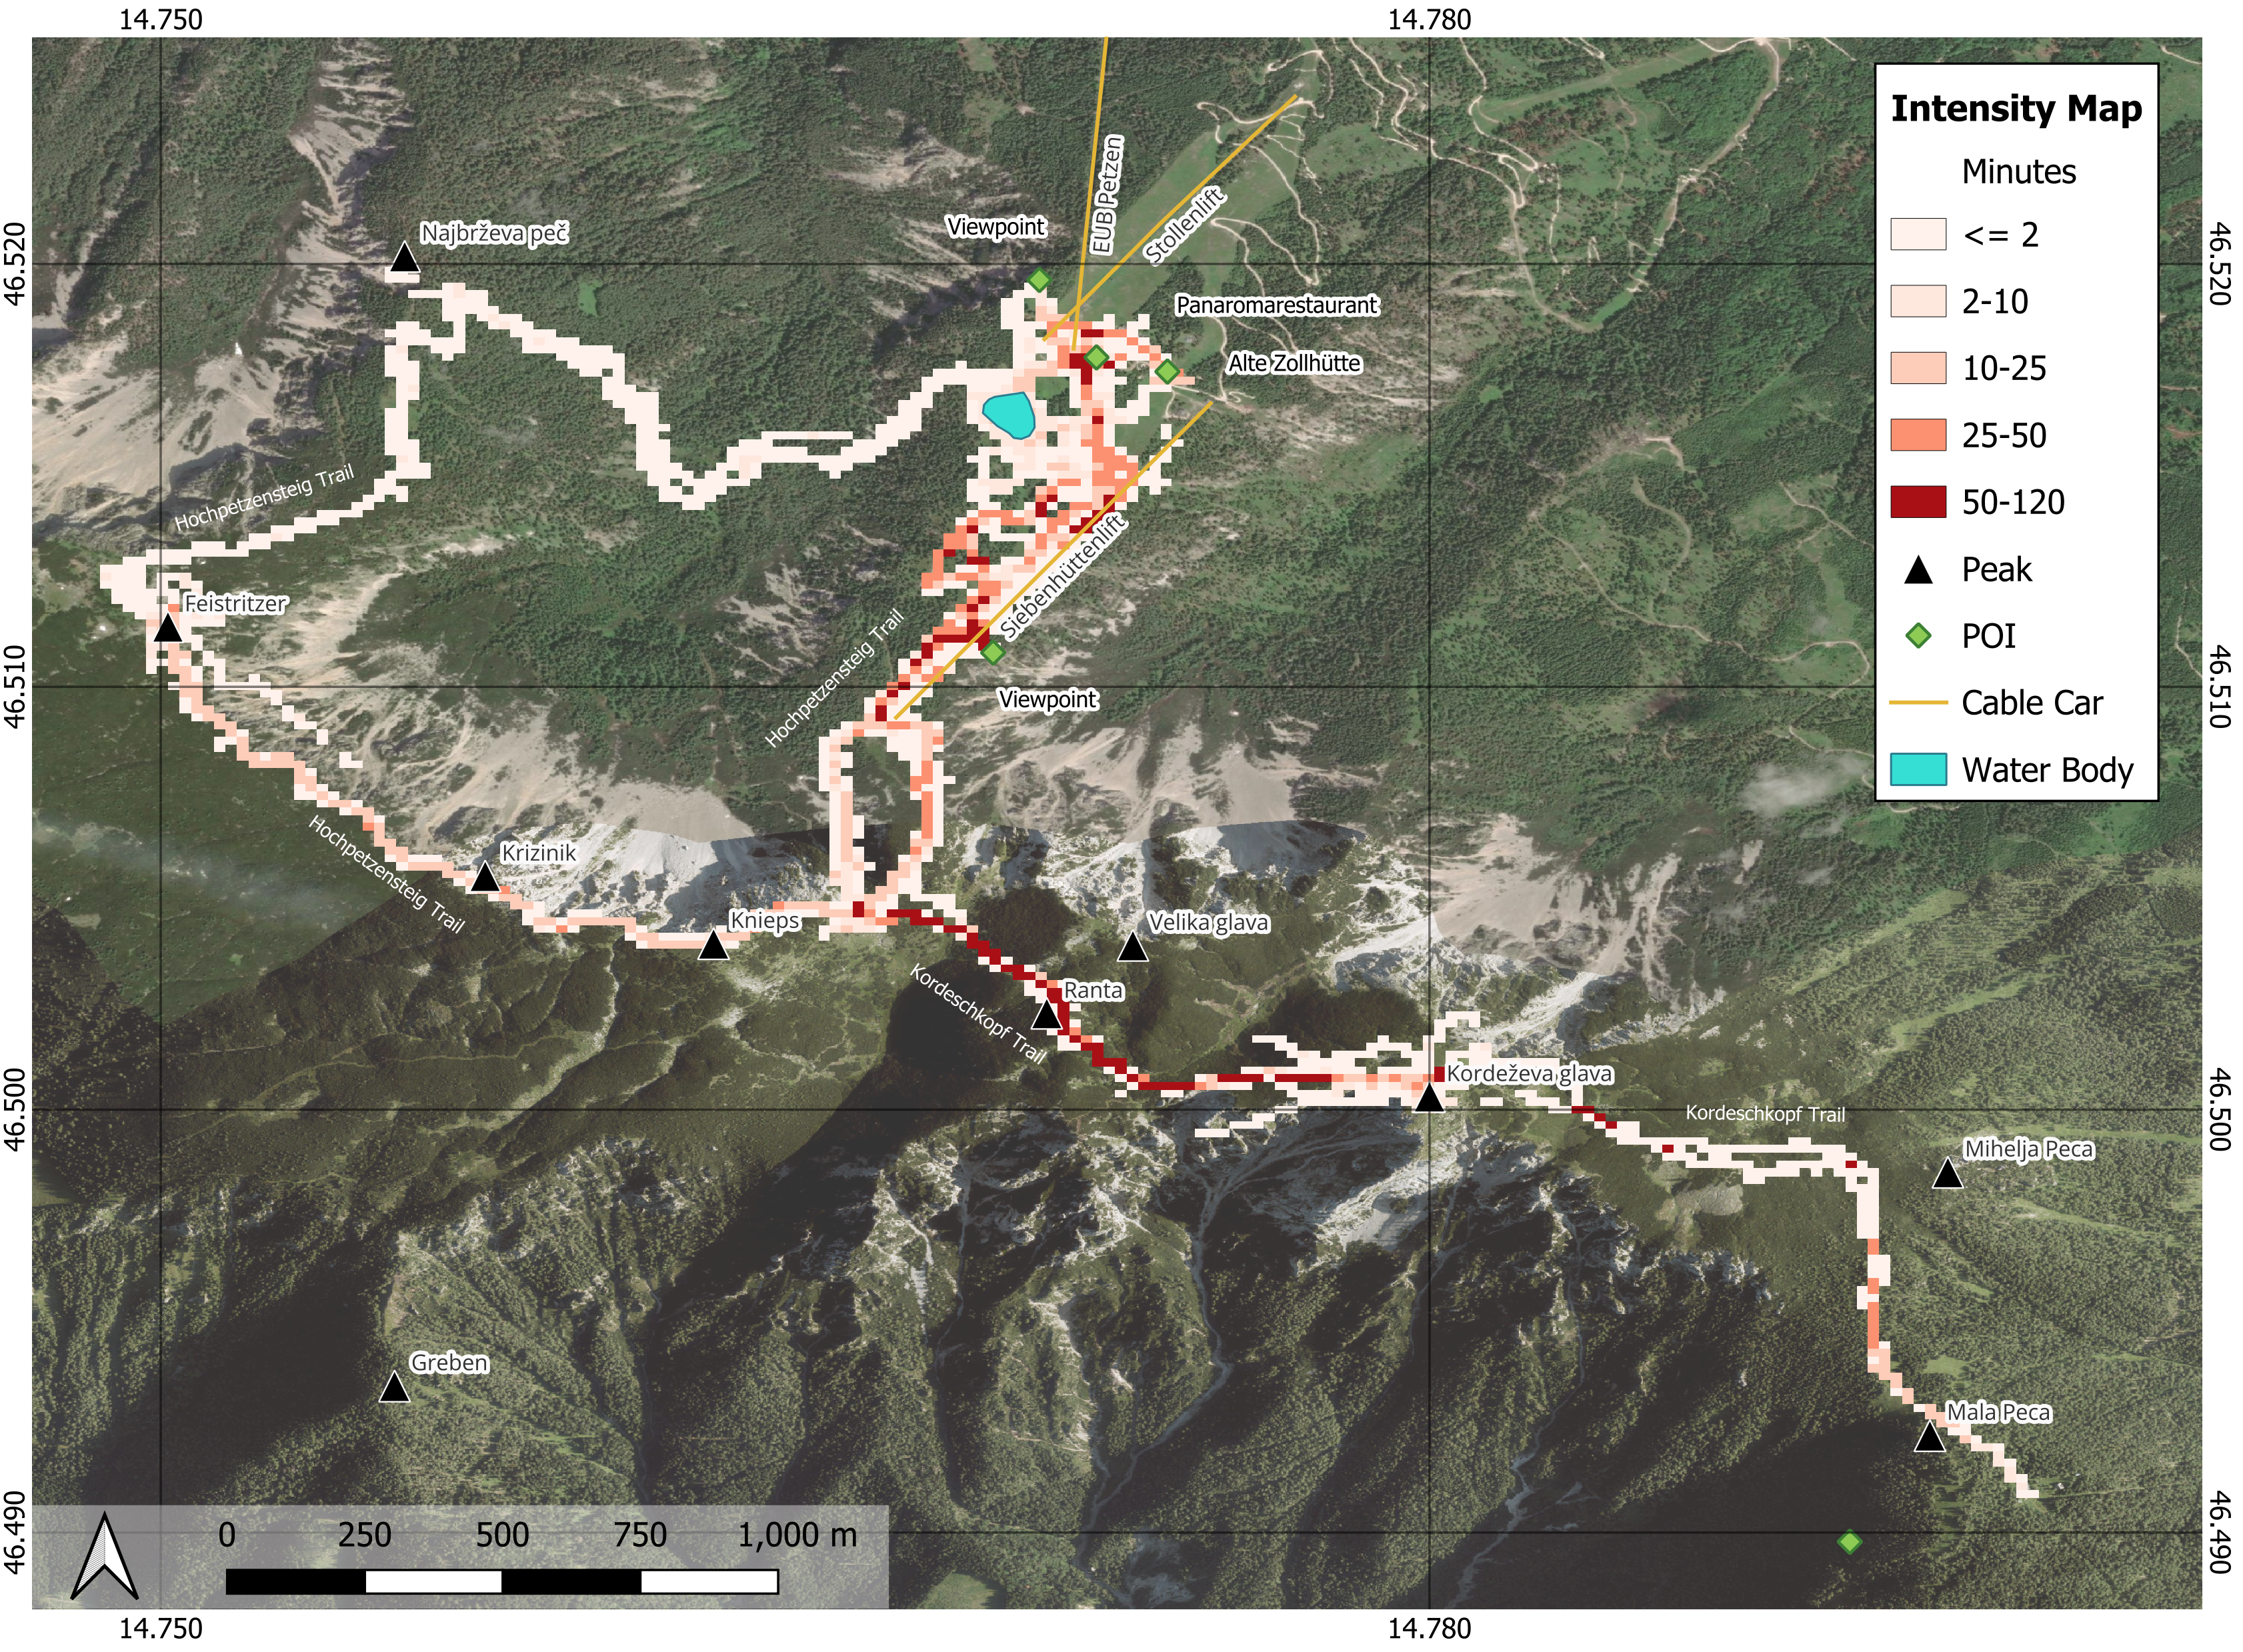
- The Intensity Map (stay-time analysis) provides additional information on how long visitors remain in specific locations. It is based on 30-meter grid cells and shows duration categories ranging from less than 2 minutes to 50–120 minutes. This allows identification of:
- Areas where visitors only pass through briefly
- Viewpoints, resting areas, or attractions with longer dwell times
- Sites potentially exposed to prolonged disturbance
- Locations where infrastructure (benches, signage, waste management) may be required
- Areas where management interventions could reduce pressure
- This map answers the question: Where do visitors stay, and for how long?
- The Density Map (heatmap of visitor counts) visualizes how frequently specific areas were used. The standardized scale from 0 (low use) to 100 (high use) allows clear identification of:
Helpful hints to use the tool proficiently
- Provide a clear initial explanation of the purpose, duration, and data handling to participants.
- Use incentives (e.g. raffle) to encourage voluntary participation.
- Actively involve park staff or local organizations in device distribution and ensure they understand the tool’s benefits.
- Standardize data cleaning procedures before analysis.
- Document analysis workflows to ensure replicability and transparency.
Specification
| Category | Device / Key |
| Properties |
Measurement device
|
| Range |
space
local
regional
|
Linked tools
| Category | Tool title and description |
Study object
|
Study focus
|
Work step
|
Tool purpose
|
Classic | Professional | Free to use | Experimental |
|
AI-based visitor counting from photo and video data
Use of AI-based image and video analysis software to automatically detect and count visitors from camera data, supporting continuous and non-intrusive monitoring of visitor numbers and flows in protected areas. |
|
|
|||||||
|
Automatic visitor counters
Automated sensor-based systems for quantifying visitor numbers and analyzing temporal and spatial visitation patterns in natural areas. |
|
|
|||||||
|
Camera traps for visitor monitoring
Passive recording of human presence along trails and access points using motion-triggered camera traps. |
|
|
|||||||
|
GPS device
A GPS is a small device that utilises satellite triangulation for navigation purposes. It can be a hand-held device or attached to an object in the field to gather spatial information. |
|
|
|||||||
|
Mobile phone network data for visitor monitoring
Use of anonymized and aggregated mobile network event data to estimate visitor numbers and origin areas for selected protected areas and surrounding regions. |
|
|
|||||||
|
Outdoor app data for visitor monitoring
Analysis of outdoor app data (.gpx and metadata) to understand spatial distribution of digital trails and estimated usage of trails. |
|
|
|||||||
|
Strava Metro
Strava Metro is a data service provided by Strava that uses aggregated and anonymized activity data (e.g. walking, running, cycling) from users of the Strava app to analyze movement patterns. |
|
|
Gallery
Images