Content
Strava Metro is a data service provided by Strava that uses aggregated and anonymized activity data (e.g. walking, running, cycling) from users of the Strava app to analyze movement patterns.
Classification
Key characteristics
Tool description
Constraints
- Non-representative user base – Strava users are predominantly younger, male, and sport-oriented; results are therefore not representative of the overall visitor population.
- Activity bias – Cycling activities are typically overrepresented, while hiking and other leisure activities may be underrepresented.
- Trail bias – Frequently used sport-oriented routes may be overrepresented, whereas touristic or short recreational trails (e.g. to viewpoints or waterfalls) may be underrepresented or absent.
- Partial coverage – Only a small proportion of total trail use is captured, limited to visitors actively using the Strava app.
- Limited resolution due to privacy rules – Data precision decreases at finer temporal scales (e.g. daily or hourly), and low counts (e.g. fewer than 5 users) are not reported.
- Complementary method only – Strava Metro does not replace traditional monitoring tools such as automatic counters or visitor surveys and should be used in combination with them.
- Access limitations – Although Strava Metro data may be provided free of charge, access is restricted and typically oriented toward active mobility or transport planning organisations; obtaining access can be challenging.
Requirements
- Partnership with Strava Metro
- GIS software and technical expertise for spatial data integration and analysis or use of build-in dashboard provided by Strava Metro
- Calibration with on-site monitoring tools (counters, surveys)
- Awareness of sampling bias and clear communication of uncertainty and limits
- Privacy compliant data handling
Tool Impact
Best Practices
-
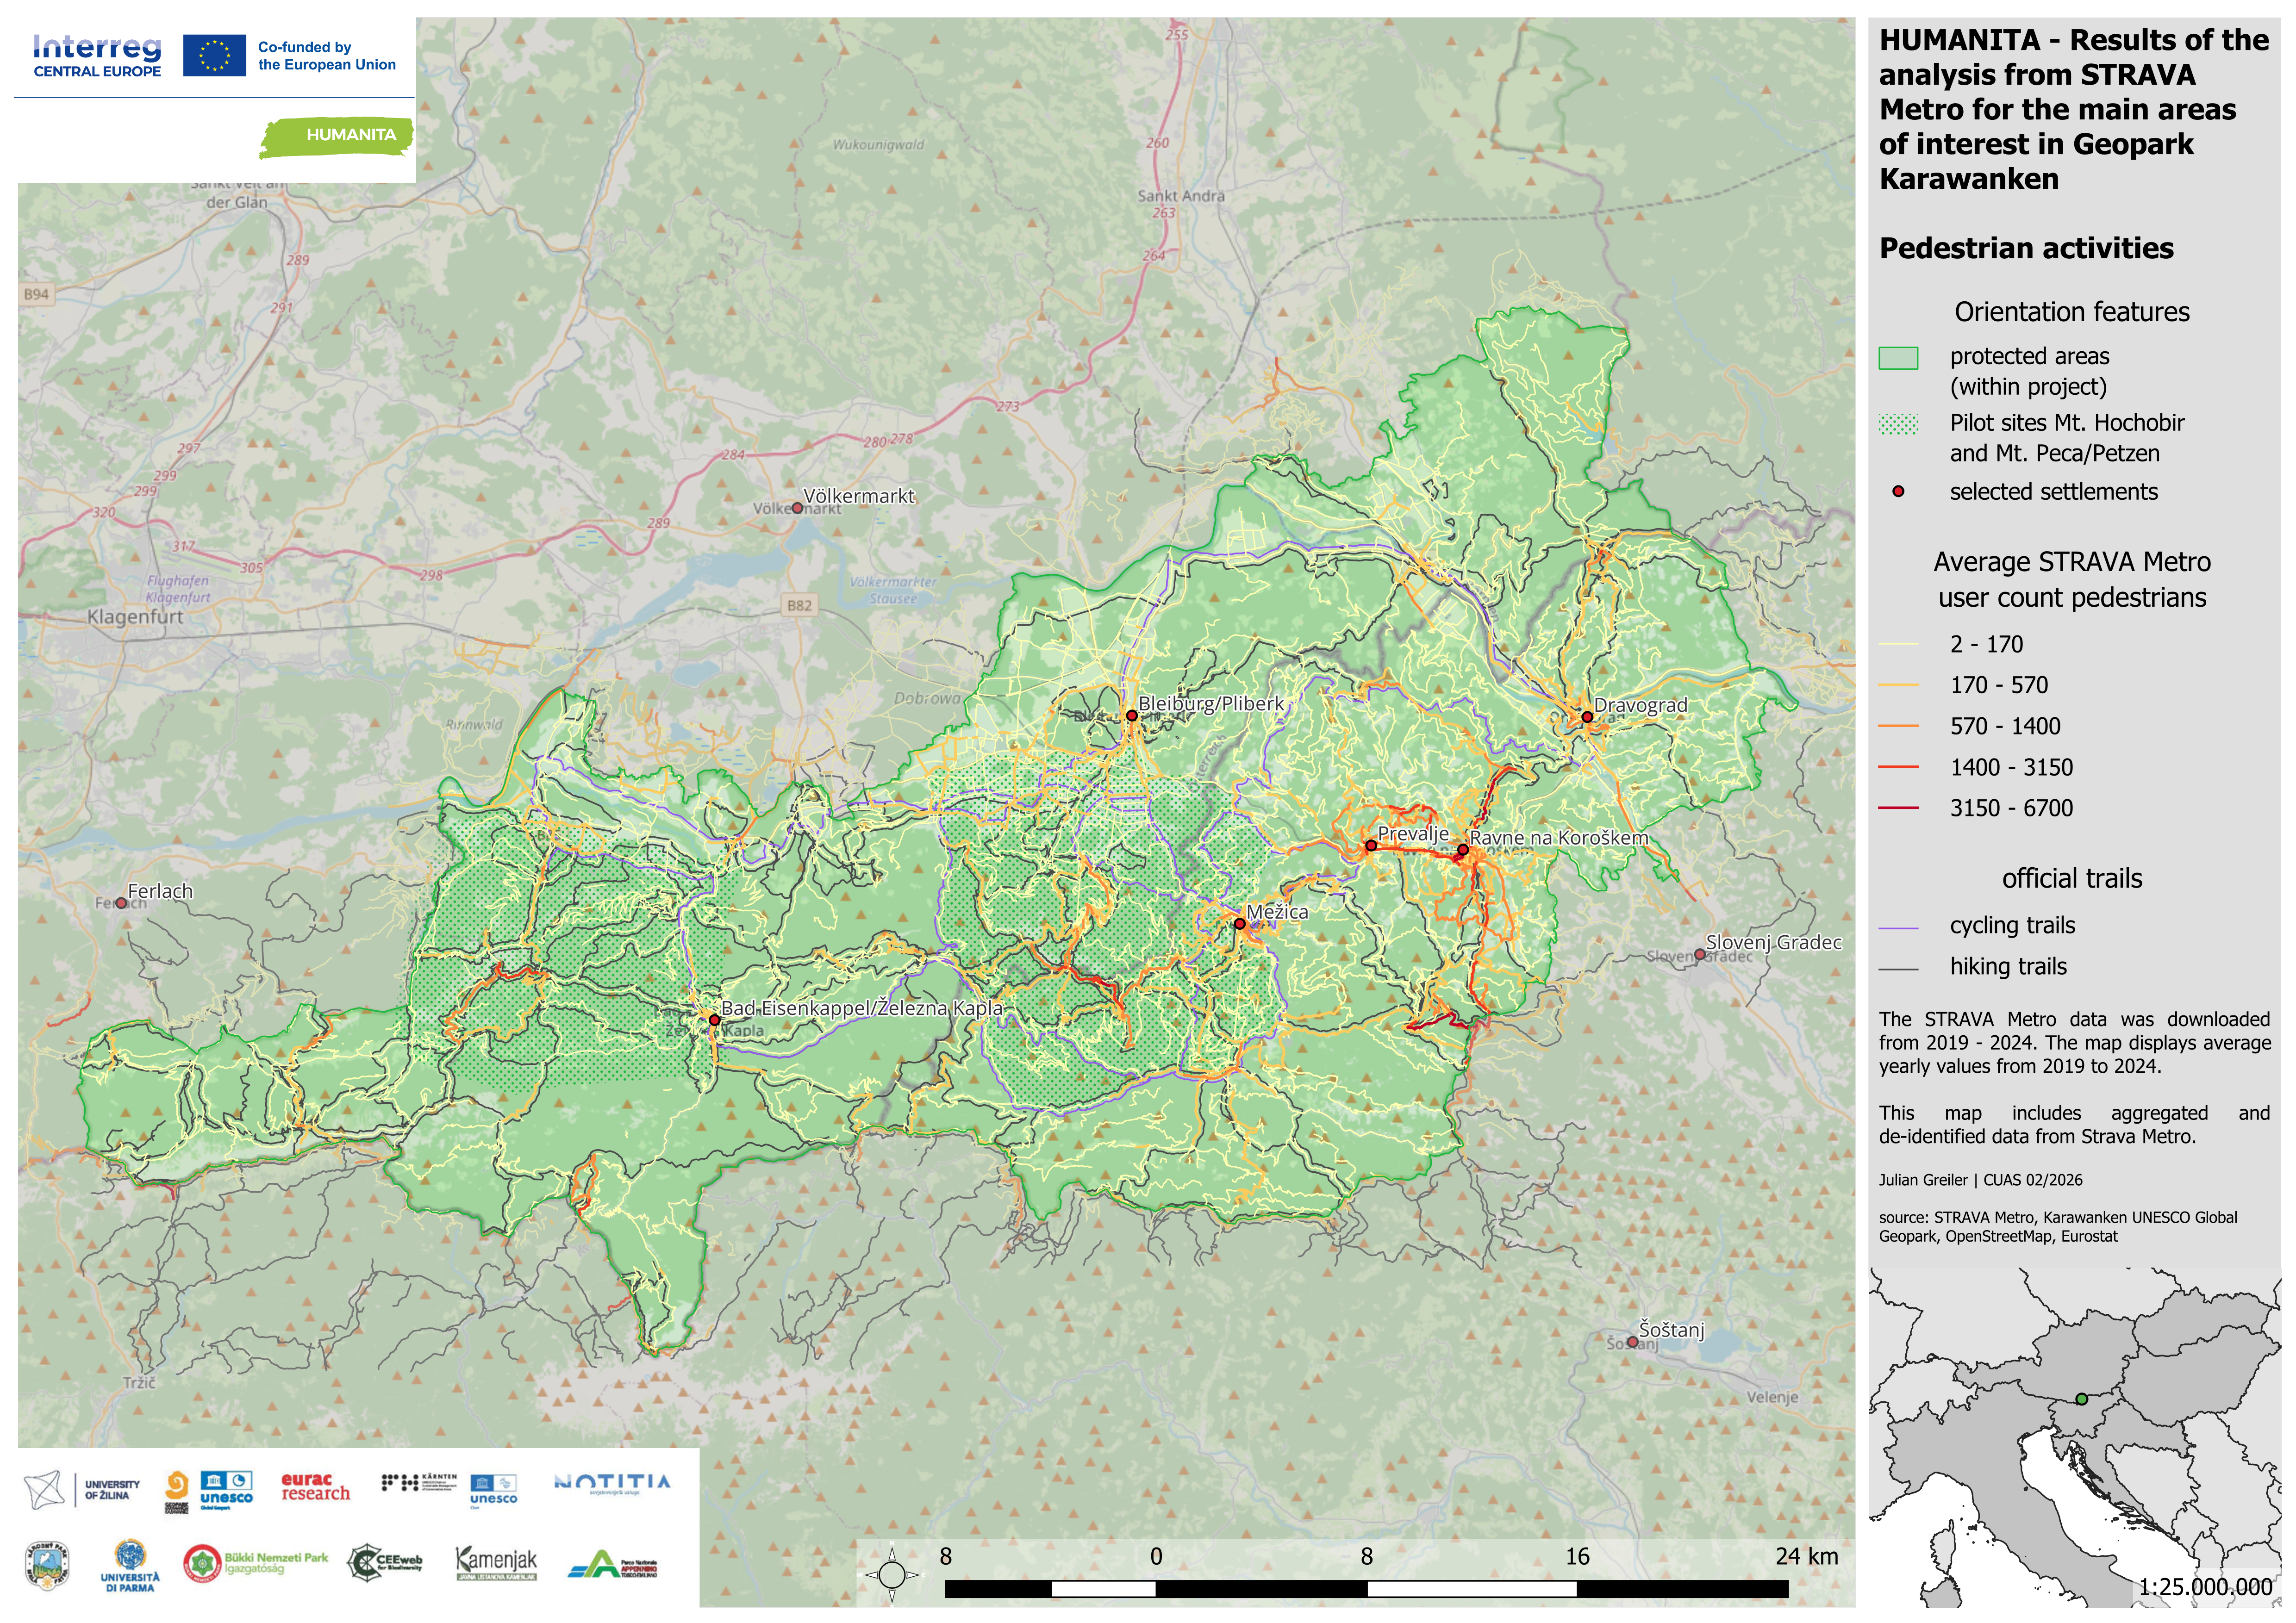
Within the Interreg Central Europe project HUMANITA, data from the outdoor and fitness apps Bergfex, Komoot, Outdooractive, Trailforks, and Strava were analyzed to estimate spatial hotspots and low-use areas in pilot regions. The objective was to identify officially promoted and unofficial user-generated activities that may indicate recreational trends, development potential, or conflicts within protected areas. Tour data were systematically organized and integrated into a GIS project. This enabled protected area managers to detect clusters of digitally promoted routes, identify potentially problematic trails in sensitive zones, and proactively manage online content where necessary. The analysis provided strategic insights into how digital platforms shape visitor distribution and perception of landscapes.
Helpful hints to use the tool proficiently
- Clearly define management-relevant spatial units (e.g. trail sections, zones, protected area boundaries) before analysis.
- Interpret results as relative intensity patterns, not absolute visitor numbers.
- Always combine Strava Metro data with on-site counters for calibration.
- Pay particular attention to unofficial or newly emerging routes visible in the data.
- Consider seasonal and activity-type filters (e.g. cycling vs. running) when analyzing patterns.
- Be cautious when interpreting low-use or masked values due to privacy thresholds.
- Monitor trends over multiple time periods to detect changes in activity distribution.
- Communicate clearly that the dataset reflects a sport-oriented user group, not the entire visitor population.
- Coordinate with park management when identifying sensitive areas that may require digital communication or mitigation measures.
- Use the built-in Strava Metro dashboard for exploratory analysis before conducting detailed GIS-based assessments.
Specification
| Category | Software |
| Platform |
Desktop
Web
|
| Operating system |
OS-independent
|
| Mode | Both online and offline |
Linked tools
| Category | Tool title and description |
Study object
|
Study focus
|
Work step
|
Tool purpose
|
Classic | Professional | Free to use | Experimental |
|
Amphibian Disease Monitoring Protocol
Molecular diagnostic toolkit for detecting and monitoring amphibian pathogens (chytrid fungus and ranavirus) in field-collected samples using real-time PCR methodology. |
|
|
|||||||
|
Automatic visitor counters
Automated sensor-based systems for quantifying visitor numbers and analyzing temporal and spatial visitation patterns in natural areas. |
|
|
|||||||
|
GPS Loggers for visitor monitoring
Portable devices used to record visitor movement patterns, routes, speed, and stay times, providing spatially explicit data to better understand visitor flows and site use. |
|
|
|||||||
|
Mobile phone network data for visitor monitoring
Use of anonymized and aggregated mobile network event data to estimate visitor numbers and origin areas for selected protected areas and surrounding regions. |
|
|
|||||||
|
Outdoor app data for visitor monitoring
Analysis of outdoor app data (.gpx and metadata) to understand spatial distribution of digital trails and estimated usage of trails. |
|
|